
A benchmark feels like evidence. It has a percentage, a source, and a chart. So it goes into the forecast, the forecast goes into the budget, and the budget goes into the pilot approval.
Then the pilot runs, the numbers come in lower, and the team spends the review meeting defending a plan that was built on someone else's campaign.
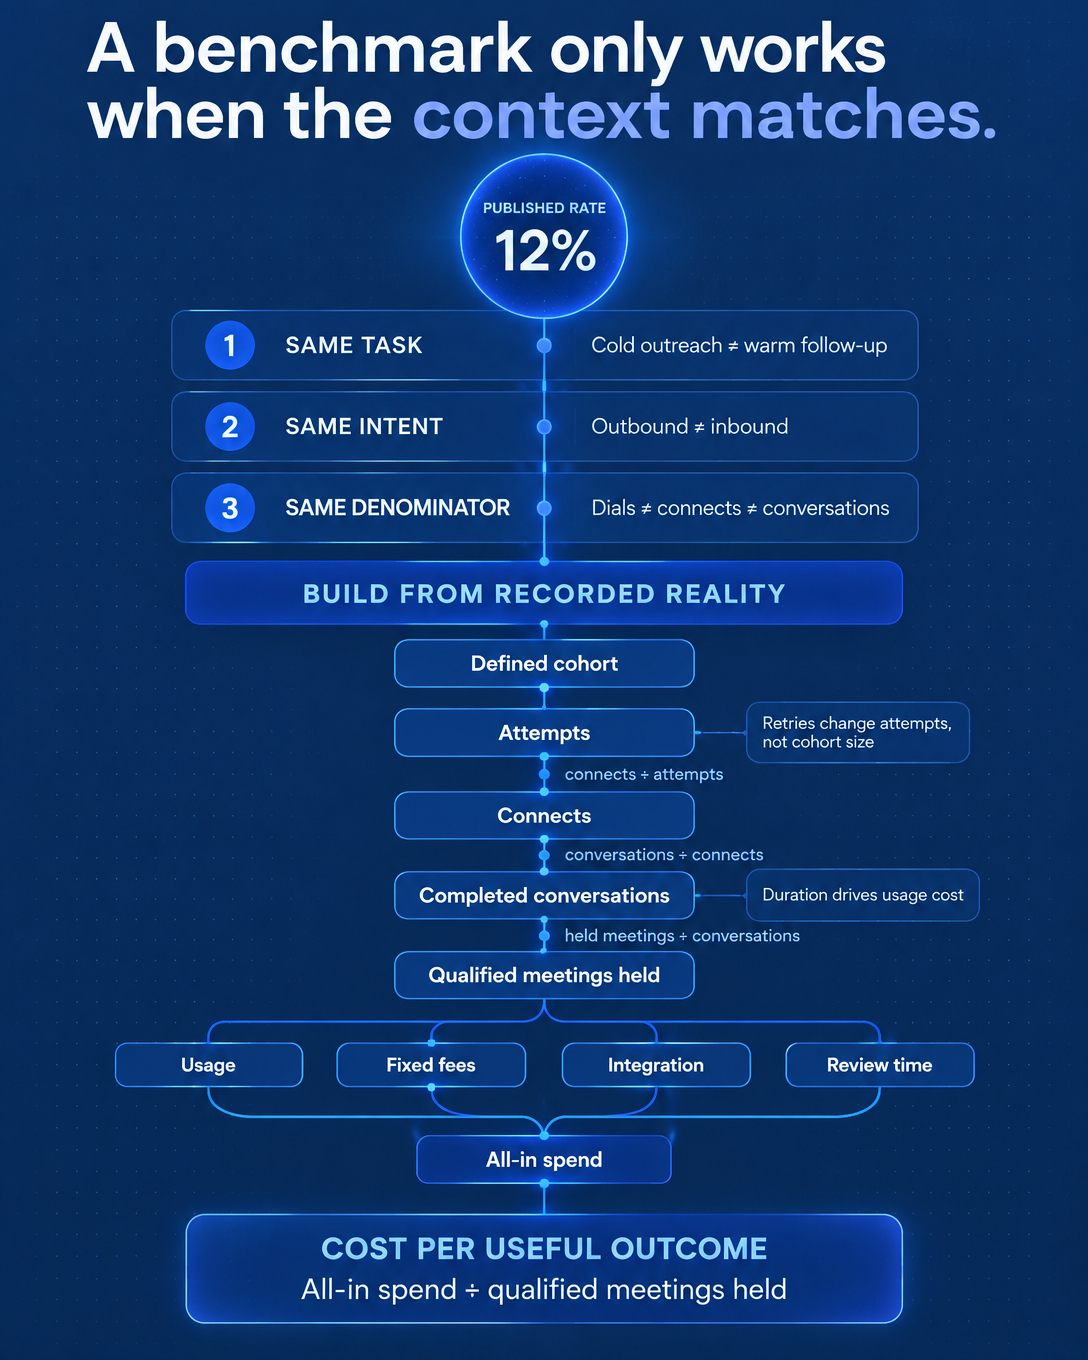
The problem sits in the benchmark itself. Published AI calling rates measure different tasks, different audiences, and different denominators. Some measure customers calling businesses. Using them to budget a seller-led prospecting campaign produces a forecast that fails before the first dial.
Three Reasons Benchmarks Break Your Budget
1. The task varies, and the rate varies with it
Published figures show how wide the spread runs. Dial-to-meeting rates for AI calling on cold lists sit at 1.2 to 2.8 percent in B2B SaaS, while AI follow-up on a fresh form fill reaches 18 to 27 percent conversion to conversation.
Both get labeled "conversion." They describe different jobs. A blended benchmark averages across tasks you will never run, which makes it useless for the one task you will.
2. Inbound numbers get quoted as outbound evidence
Analysis of 60 million phone conversations reports 37 percent of phone leads converting during the call. Those are customers who picked up the phone and called a business with intent to buy.
Inbound calls convert 3 to 5 times higher than outbound because the prospect already wants something. Forecasting a cold prospecting campaign from inbound figures guarantees disappointment, and the disappointment lands on the pilot instead of the forecast.
3. The denominator is rarely stated
One source counts dials. Another counts connects. A third counts qualified conversations. A 12 percent booking rate on connects and a 12 percent booking rate on dials describe operations that differ by an order of magnitude.
A rate without its denominator is a number without a meaning.
What to Use Instead: Your Own Measured Topology
A defensible budget starts from inputs you recorded yourself. Build it from three sources.
Your pilot's measured durations. Average call duration drives billable minutes more than any conversion assumption. Duration also tells you whether the campaign is working at all. Calls under 30 seconds on a C-level list usually signal bad numbers or gatekeepers, which is a list problem, and no benchmark will surface it for you.
Your actual retry policy. A retry adds an attempt without adding a person to the cohort. Record attempts, connects, completed conversations, and outcomes as separate counts. Then every rate you calculate has a denominator you can name in a finance review.
Your written assumptions. List what changes the budget: usable numbers, calling windows, retry limits, transfer behavior, and the share of outcomes that need human follow-through. Run an expected case and a lower-utilization case. Leave industry conversion rates out of both.
Price the Full Stack, Then Divide by Outcomes
Headline per-minute rates mislead in the same way benchmarks do. A platform advertised at $0.05 per minute can cost three to six times that once voice, language model, transcription, and telephony layers are added.
Budget from the all-in figure: expected minutes times the true usage rate, plus fixed fees, concurrency charges, integration work, and ongoing review time. Then divide actual spend by qualified meetings held.
Cost per useful outcome is the number your finance team can audit. Cost per minute is the number the vendor wants you to compare.
The Pilot Is the Benchmark
A pilot exists to replace borrowed numbers with recorded ones. Define the cohort, the acceptance criteria for a held meeting, and the stop conditions before launch. Keep bookings, attendance, and accepted opportunities as separate statuses with separate evidence.
Teams that run this way have something to show for it. One B2B SaaS team replaced its data provider, narrowed its target profile, and added intent signals, then reached a 4.2 percent conversion rate with $2.3M in pipeline in a quarter. The result came from instrumenting their own inputs and correcting from measured reality.
Execution that you can trace produces a budget you can defend. Start with your own cohort, your own durations, and your own retry policy. The industry average belongs in someone else's spreadsheet.